Senior product designer · IBM · The Weather Channel
Turning weather from data into decisions, at 100 million users.
I was the senior designer and the final design gate on The Weather Channel app across web, iOS, and Android. I reframed three flagship features from raw data to what a person should actually do, and held the quality line so the reframe survived the build.
- Role
- Senior Product Designer, IBM / TWC (via Andela)
- Timeline
- 2023–24
- Scale
- 100M+ MAU · web, iOS, Android
The Activity Hub, held to one standard across web, iOS, and Android. Not a forecast screen. A read on what is happening right now.
- 100M+
- monthly users
- 3
- platforms unified
- 3
- flagship features owned
- 1
- design library, one standard
Context
I was a senior product designer embedded with the IBM and Weather Company team on The Weather Channel app, a product used by more than 100 million people every month across web, iOS, and Android. I led design on the Activity Hub and the Customer Journey experience, and I was the final design gate on features like the Sun and Moon explainer and Travel Forecast. Across all of it the job was the same: own visual quality across the Andela engineering team, hold the TWC Design Library to one standard, and make sure nothing reached 100 million people with the design quietly broken.
The challenge
At consumer scale, the cost of an inconsistent component isn’t a design nitpick. It’s a million people seeing the wrong thing. The app ran on web, iOS, and Android, with a design library most engineers had never read end to end. My job was the bridge: translate work from the IBM and TWC core design team into something the Andela engineering team could ship, and make sure nothing landed in production that broke the standards 100 million users had been trained to trust.
The harder problem was the Activity Hub. Weather apps have been built around forecast tiles and radar maps for two decades. But most people don’t open a weather app to read a forecast. They open it because something is happening: a thunderstorm warning, an air quality alert, a wildfire smoke advisory, a snow day. The app was good at presenting data and bad at presenting events.
The reframe
The Activity Hub wasn’t a notifications screen. It was the moment the app stopped being a forecast tool and became a situational one.
Once that landed, I stopped thinking about the Hub as a list of alerts and started thinking about it as a triage interface: what does a person need to know right now, what is relevant to them today, and what is only worth a glance. Information density became a design problem, not a content problem.
Key decisions
Triage over chronology
Most feeds sort by time. The Activity Hub sorts by relevance: severe alerts first, then today’s events, then forward-looking weather. The tradeoff is that people lose “what was the latest thing?” as a mental model. We compensated with a timestamp on every card and a clear visual line between active alerts and contextual updates.
One experience, three surfaces
The Customer Journey work (notifications, accounts, settings) had to feel identical across web, iOS, and Android. I worked component by component inside the TWC Design Library so the same setting screen on iOS felt like the same screen on Android, not a port. I gave up some platform-native ergonomics where they would have fragmented the cross-platform mental model.
Design QA as a daily practice
Visual inconsistencies at 100M MAU compound fast. I built the habit of catching them before merge: walkthroughs of in-progress builds across all three platforms, paired with a spec checklist the engineers could self-serve against. Every hour on QA was an hour not designing, but it kept the library honest and shrank the back-and-forth with engineering.
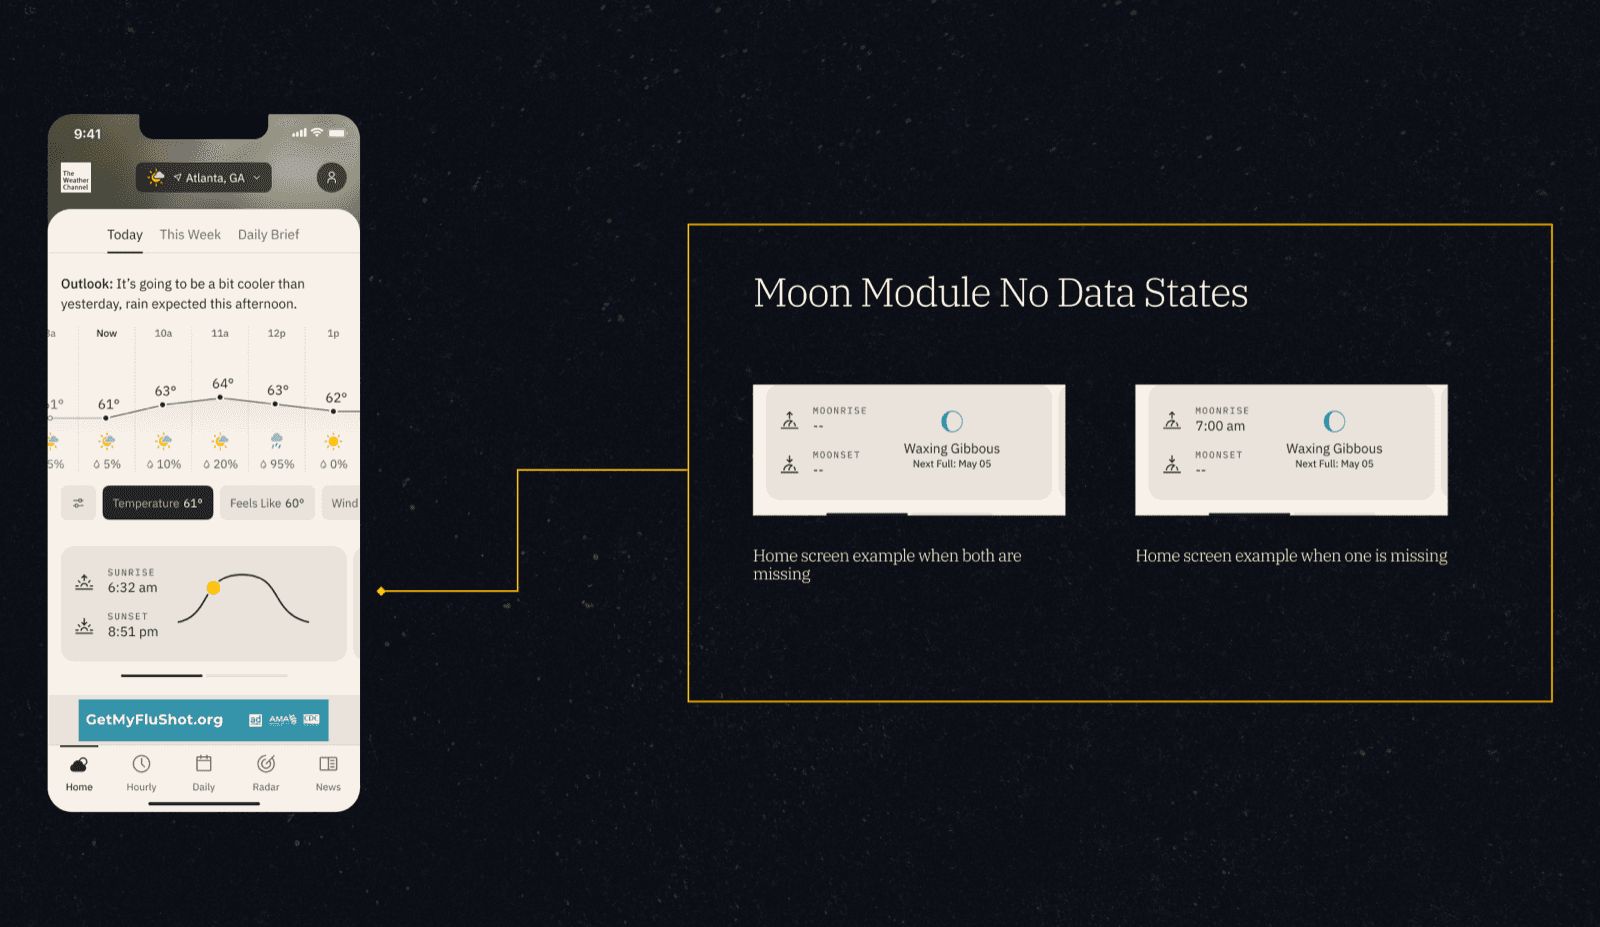
Sun and Moon explainer
Meaning first, data second
The app already showed sun and moon data: rise and set times, moon phases, illumination percentages, twilight types. Comprehension was low. People could see the numbers but most had no idea what they meant for their day.
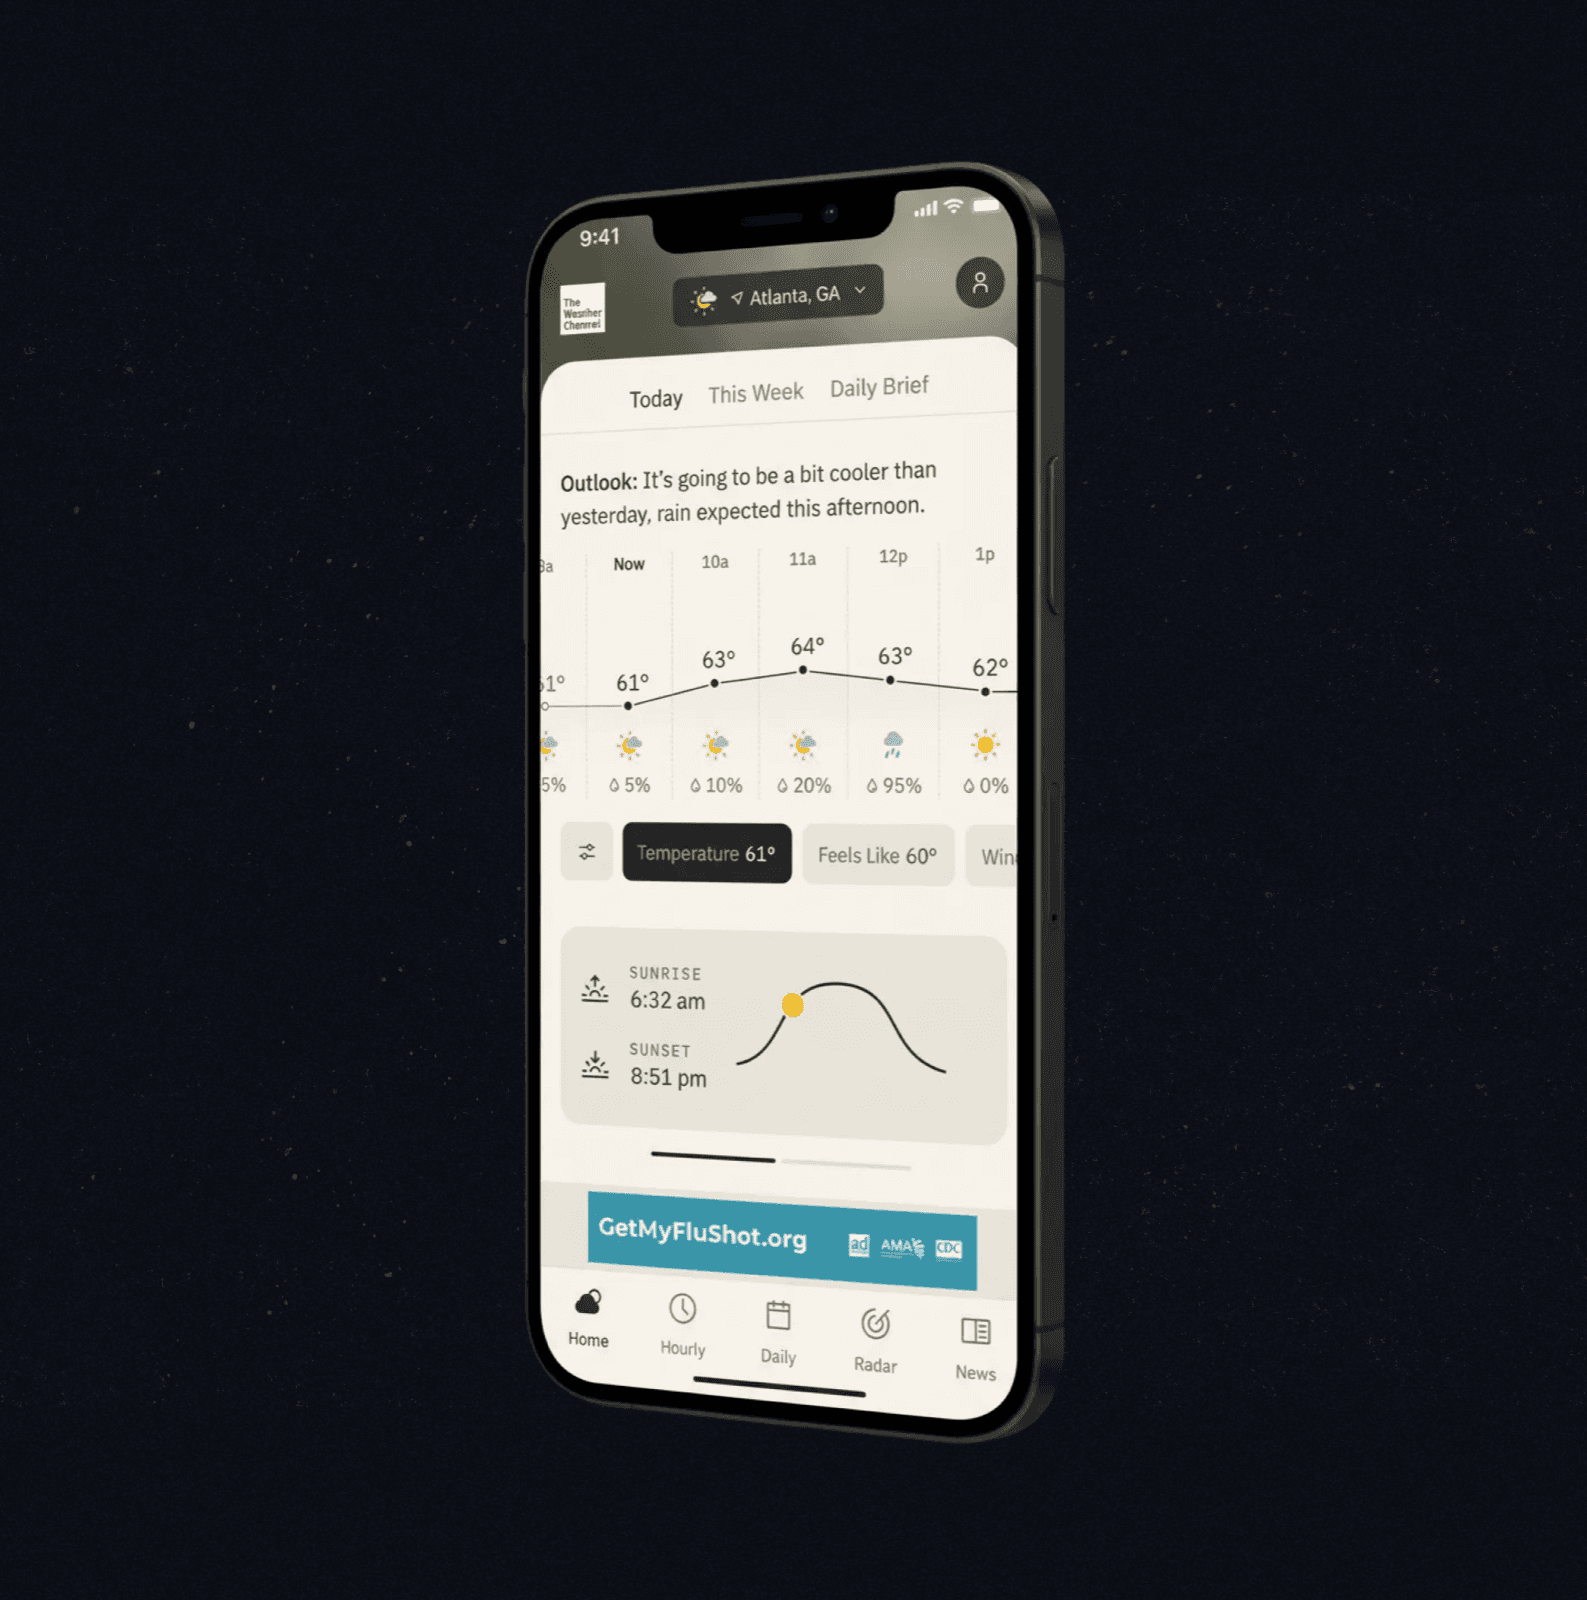
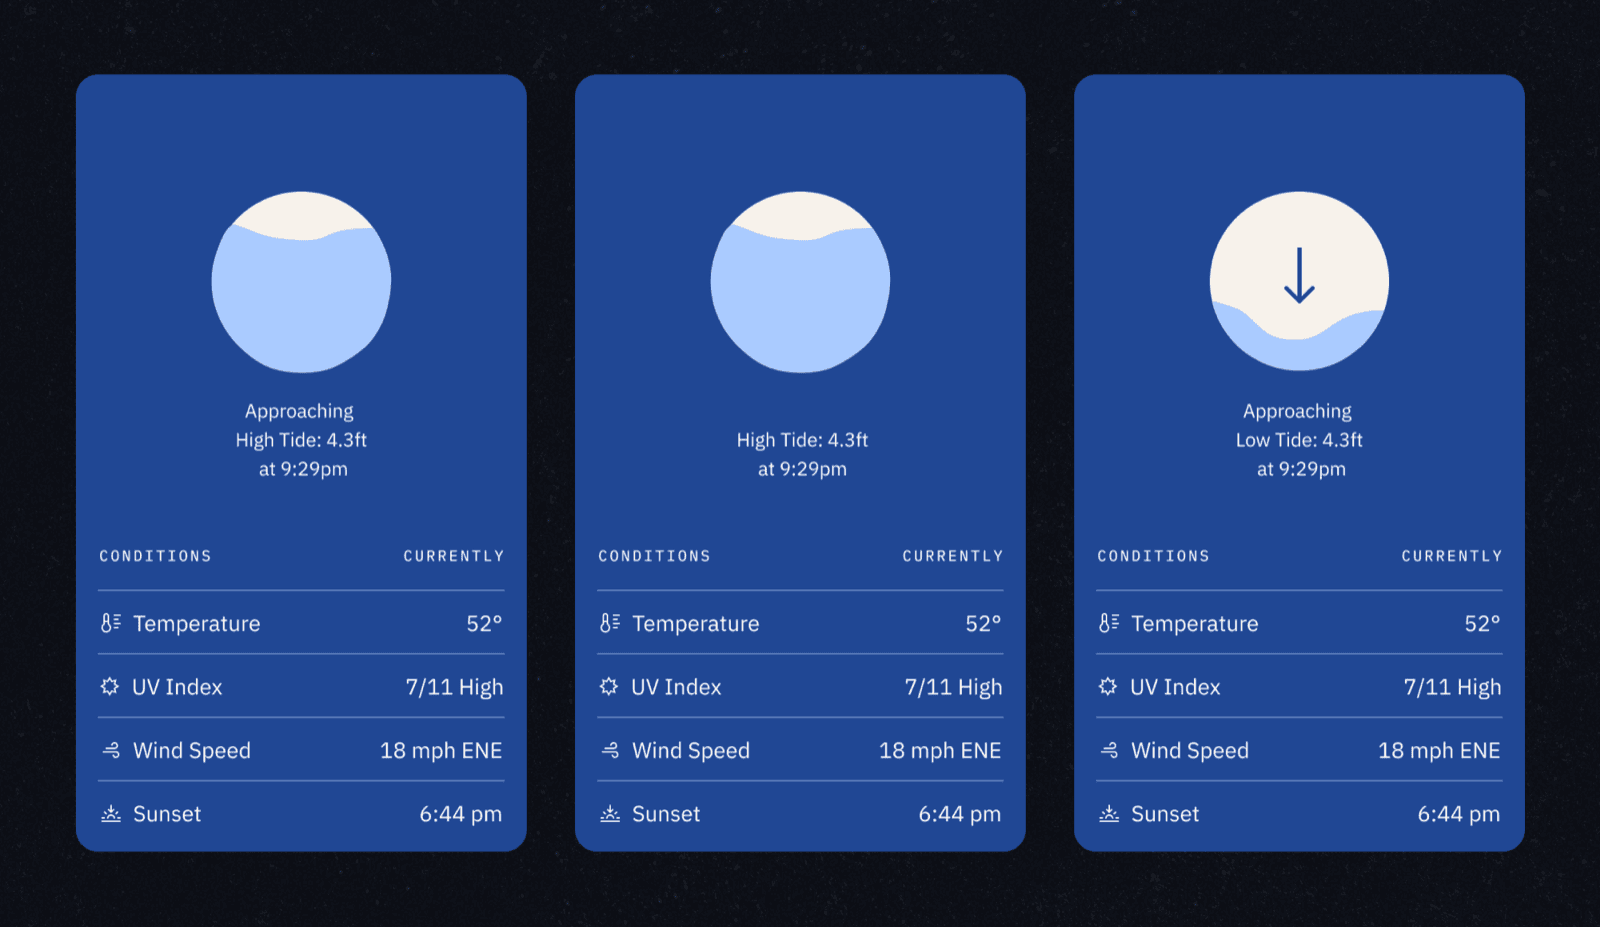
So sun, moon, tides, and stargazing stopped being four isolated modules and became one connected system, all driven by the same physics. Every chart had to answer three things before it earned its place: what is happening, why it matters, and when it is relevant.
The decision I held: a chart never ships without its sentence
The design paired every chart with one plain-language sentence: the chart as evidence, the sentence as the point. Under space pressure, the sentence is the first thing a build drops. I held the line on it. A chart without its sentence didn’t pass review, and where a surface genuinely couldn’t fit both, the rule was to keep the sentence and simplify the chart, never the other way round.
Tides were part of the same call. They belong to the moon, pulled by the same gravity, so the design carried that link through shared language rather than a separate oceanography panel. My check at the gate was continuity: in the shipped build, did tides still read as part of the moon experience, or had they drifted back into their own vocabulary.
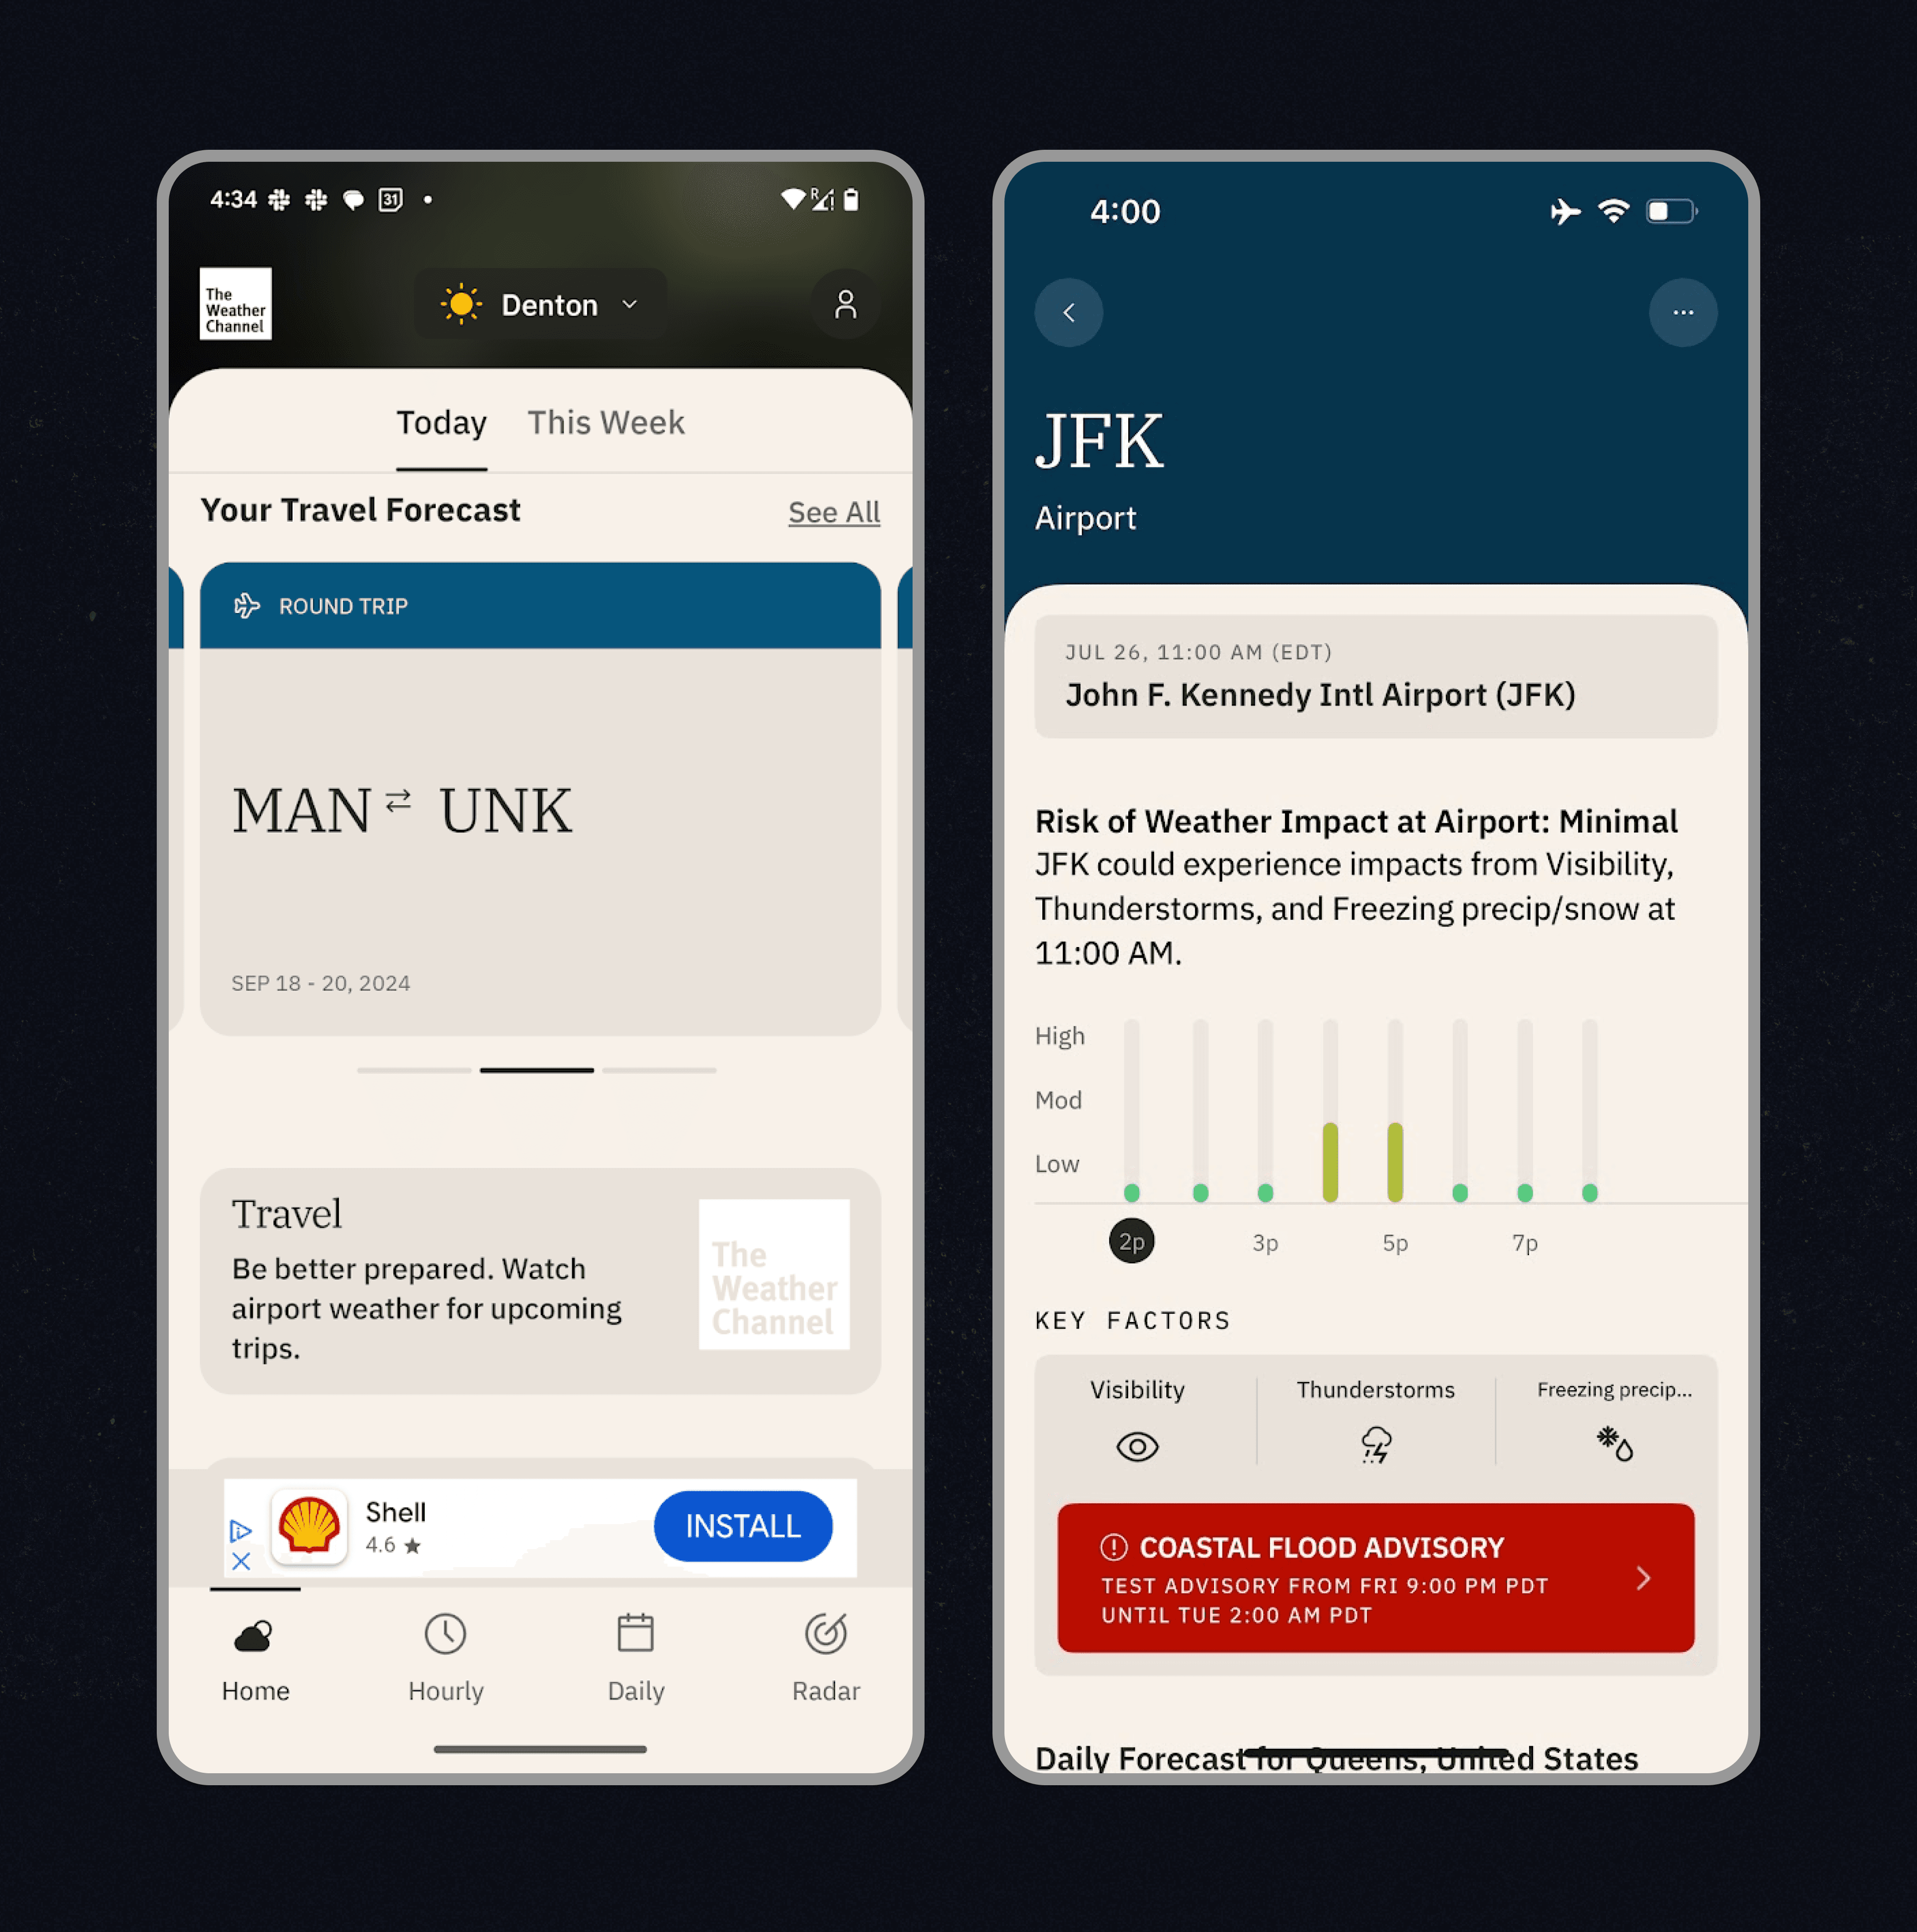
Travel Forecast
One trip, one timeline
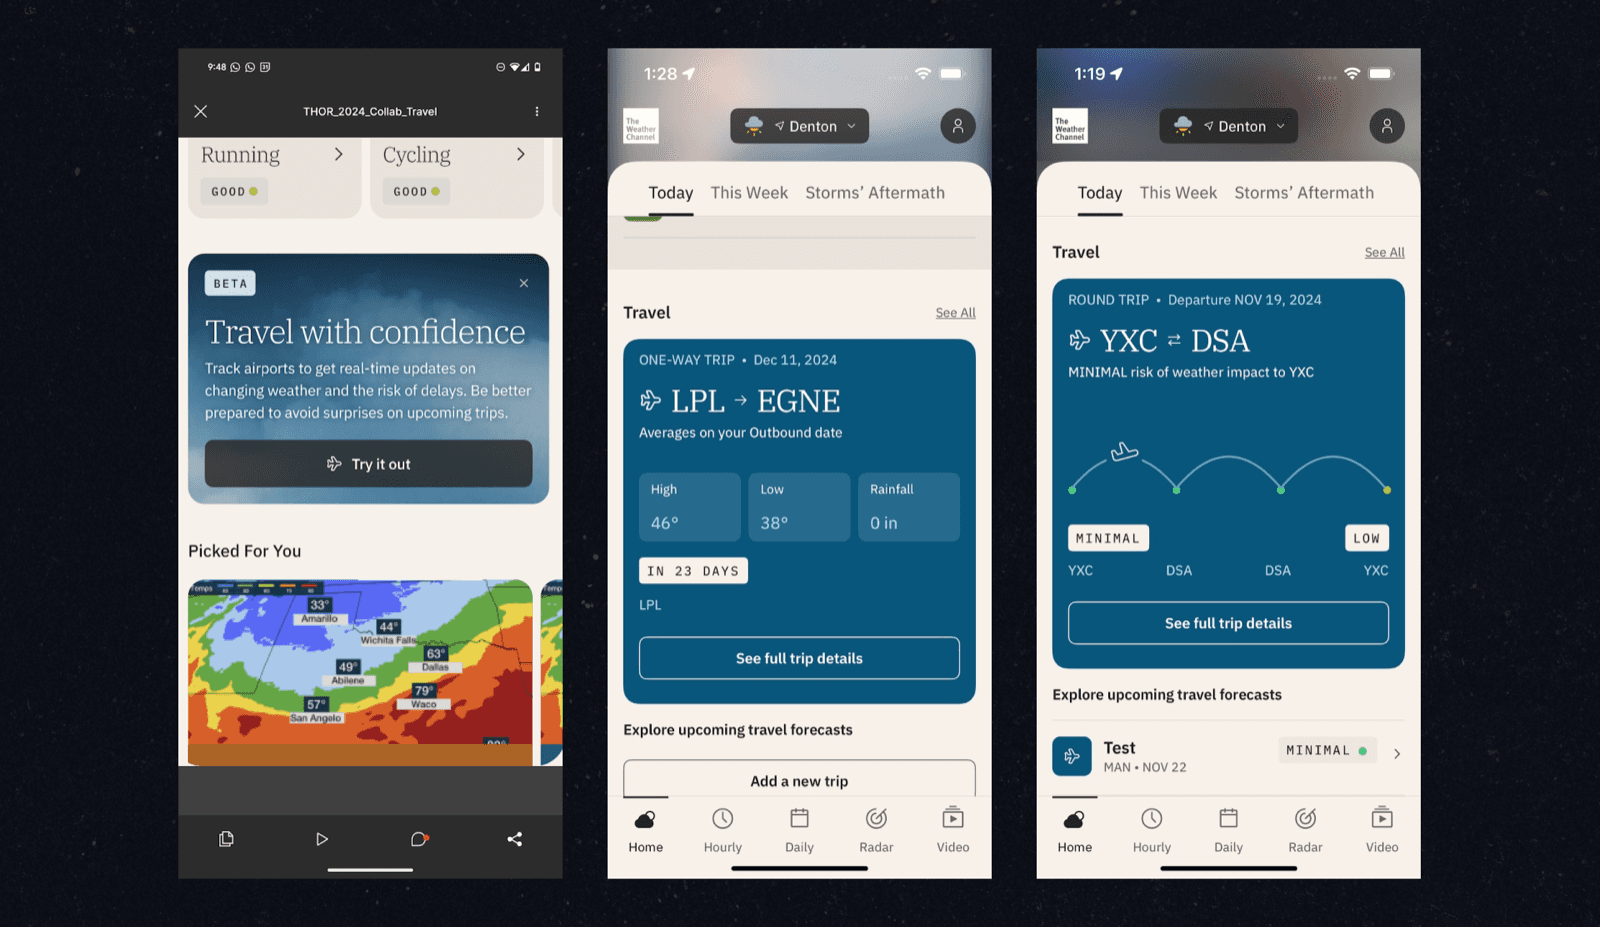
Most weather apps are location-centric. They answer “what is the weather here?” Travellers need “what will the weather be across my journey?” The people who felt this most opened the app five times to plan one trip, once per city, then stitched the results together in their head while worrying about the layover they hadn’t checked yet.
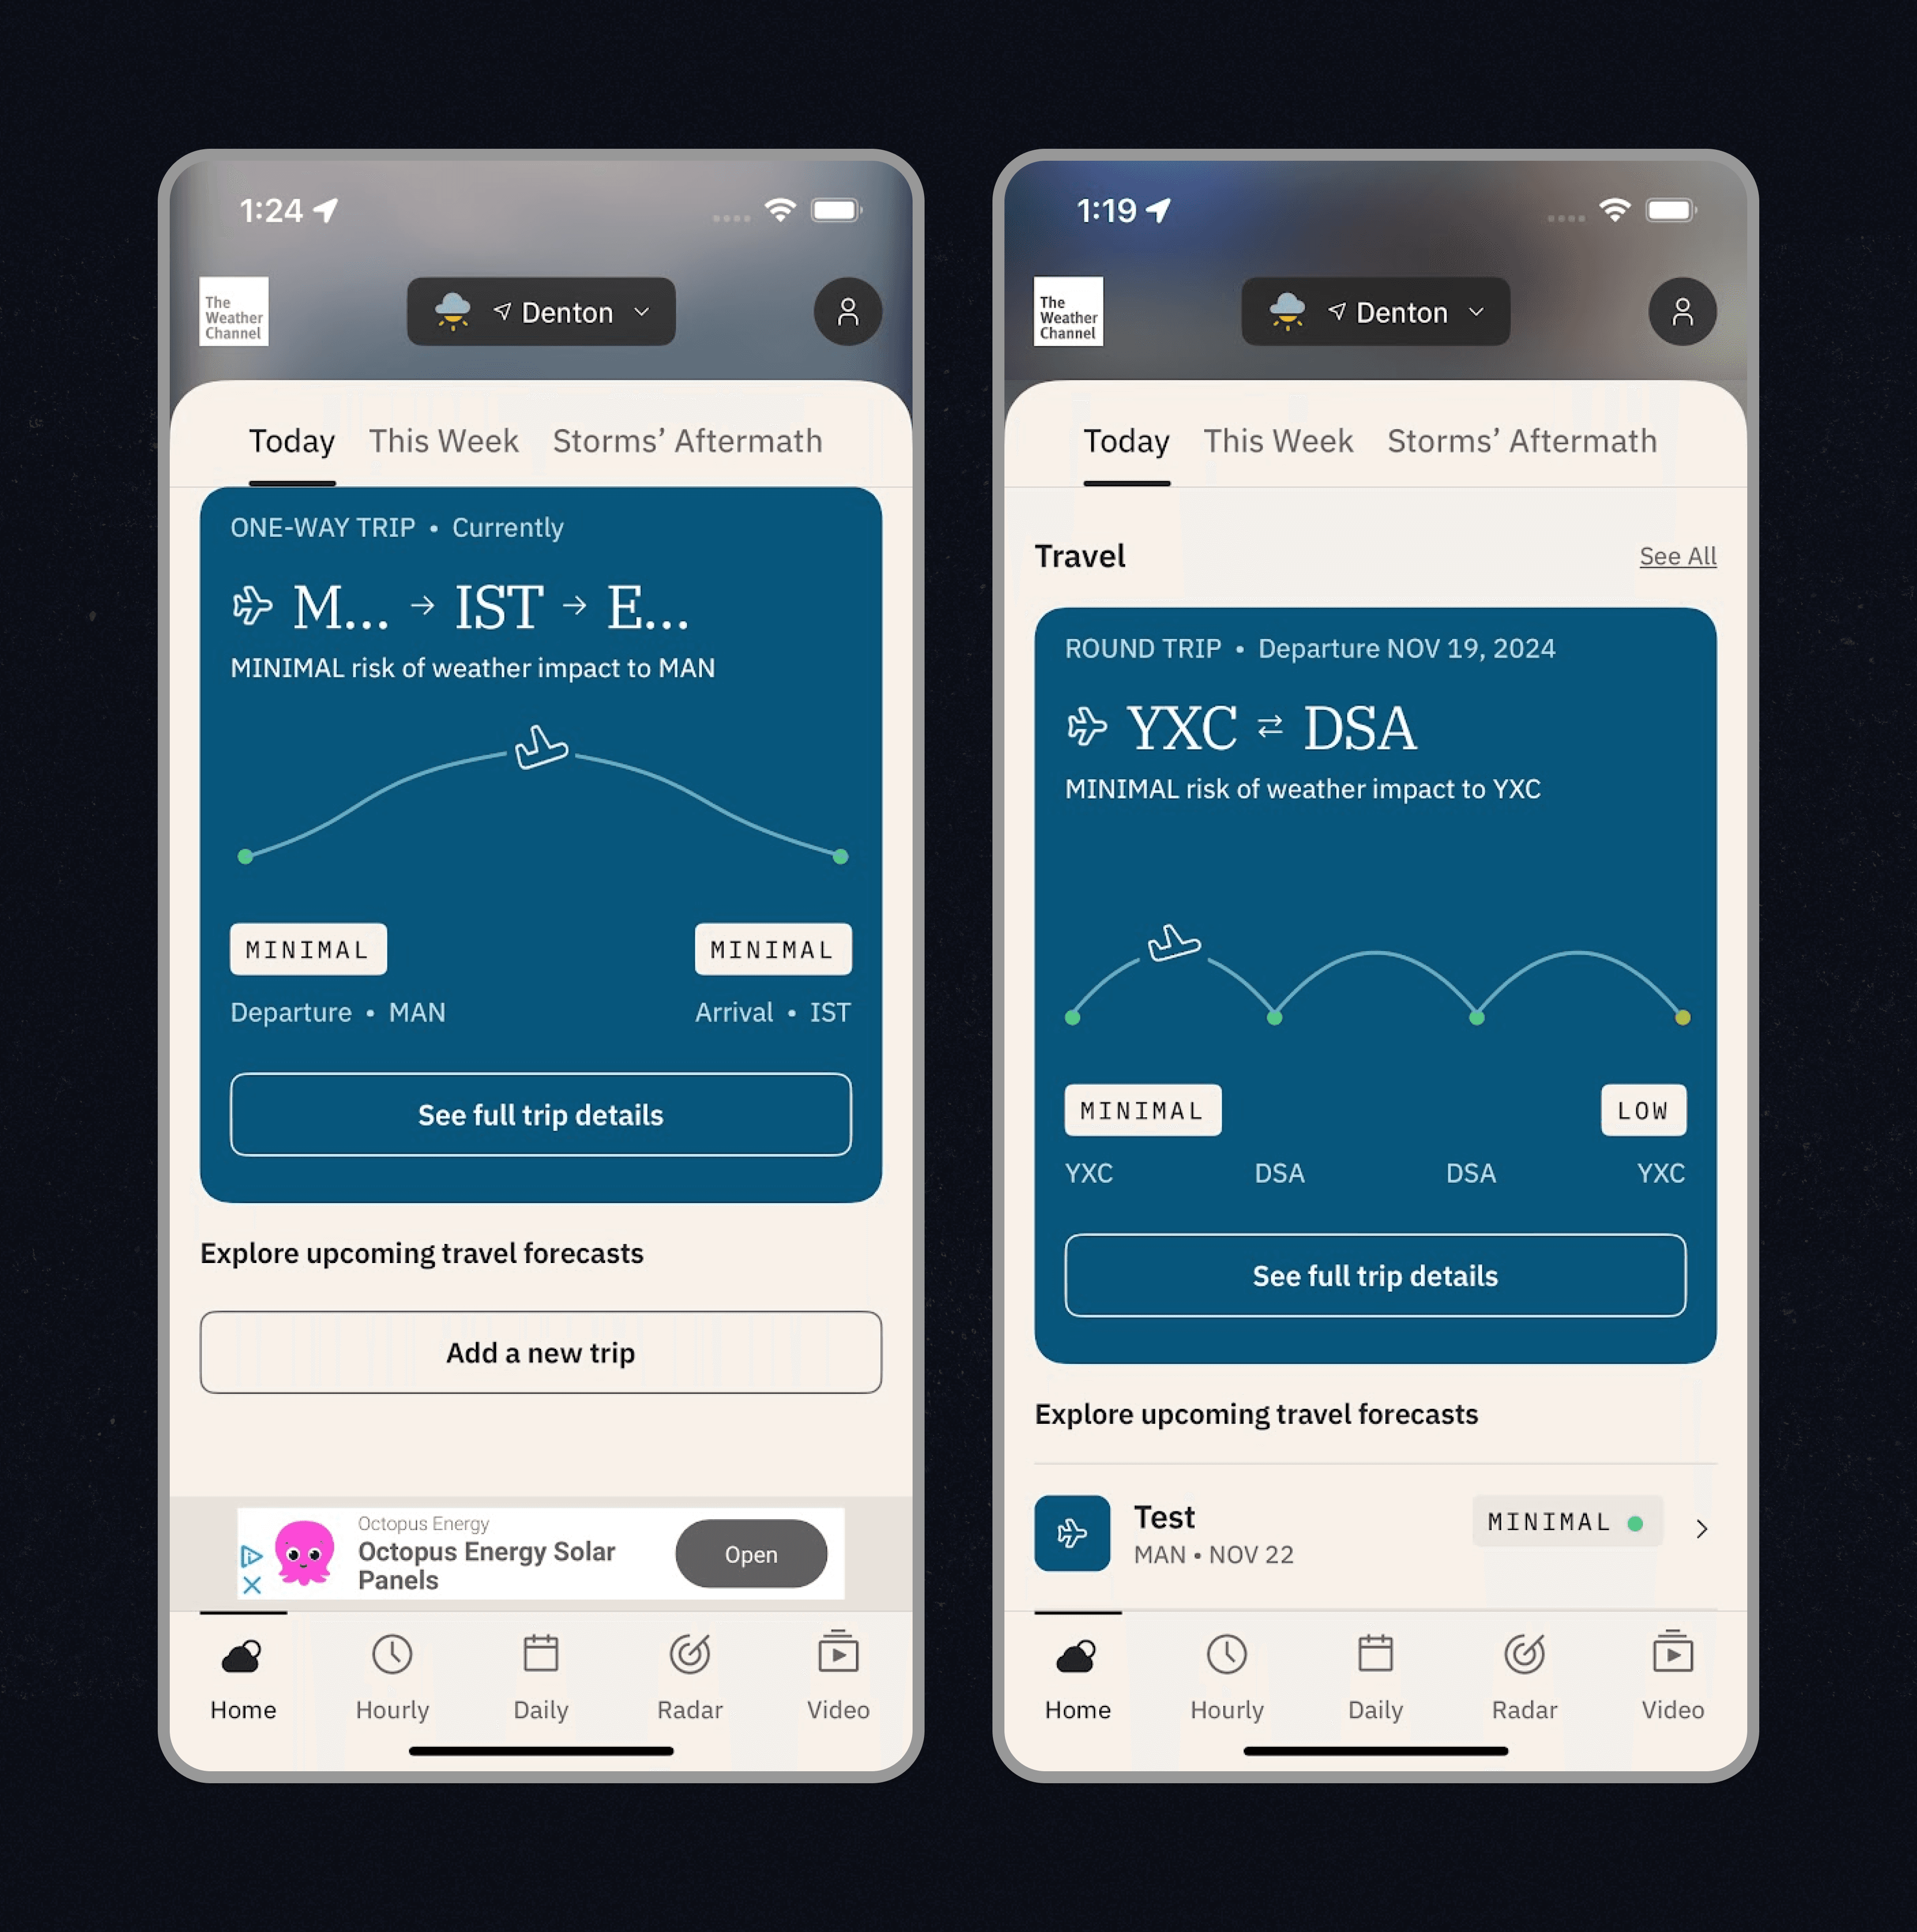
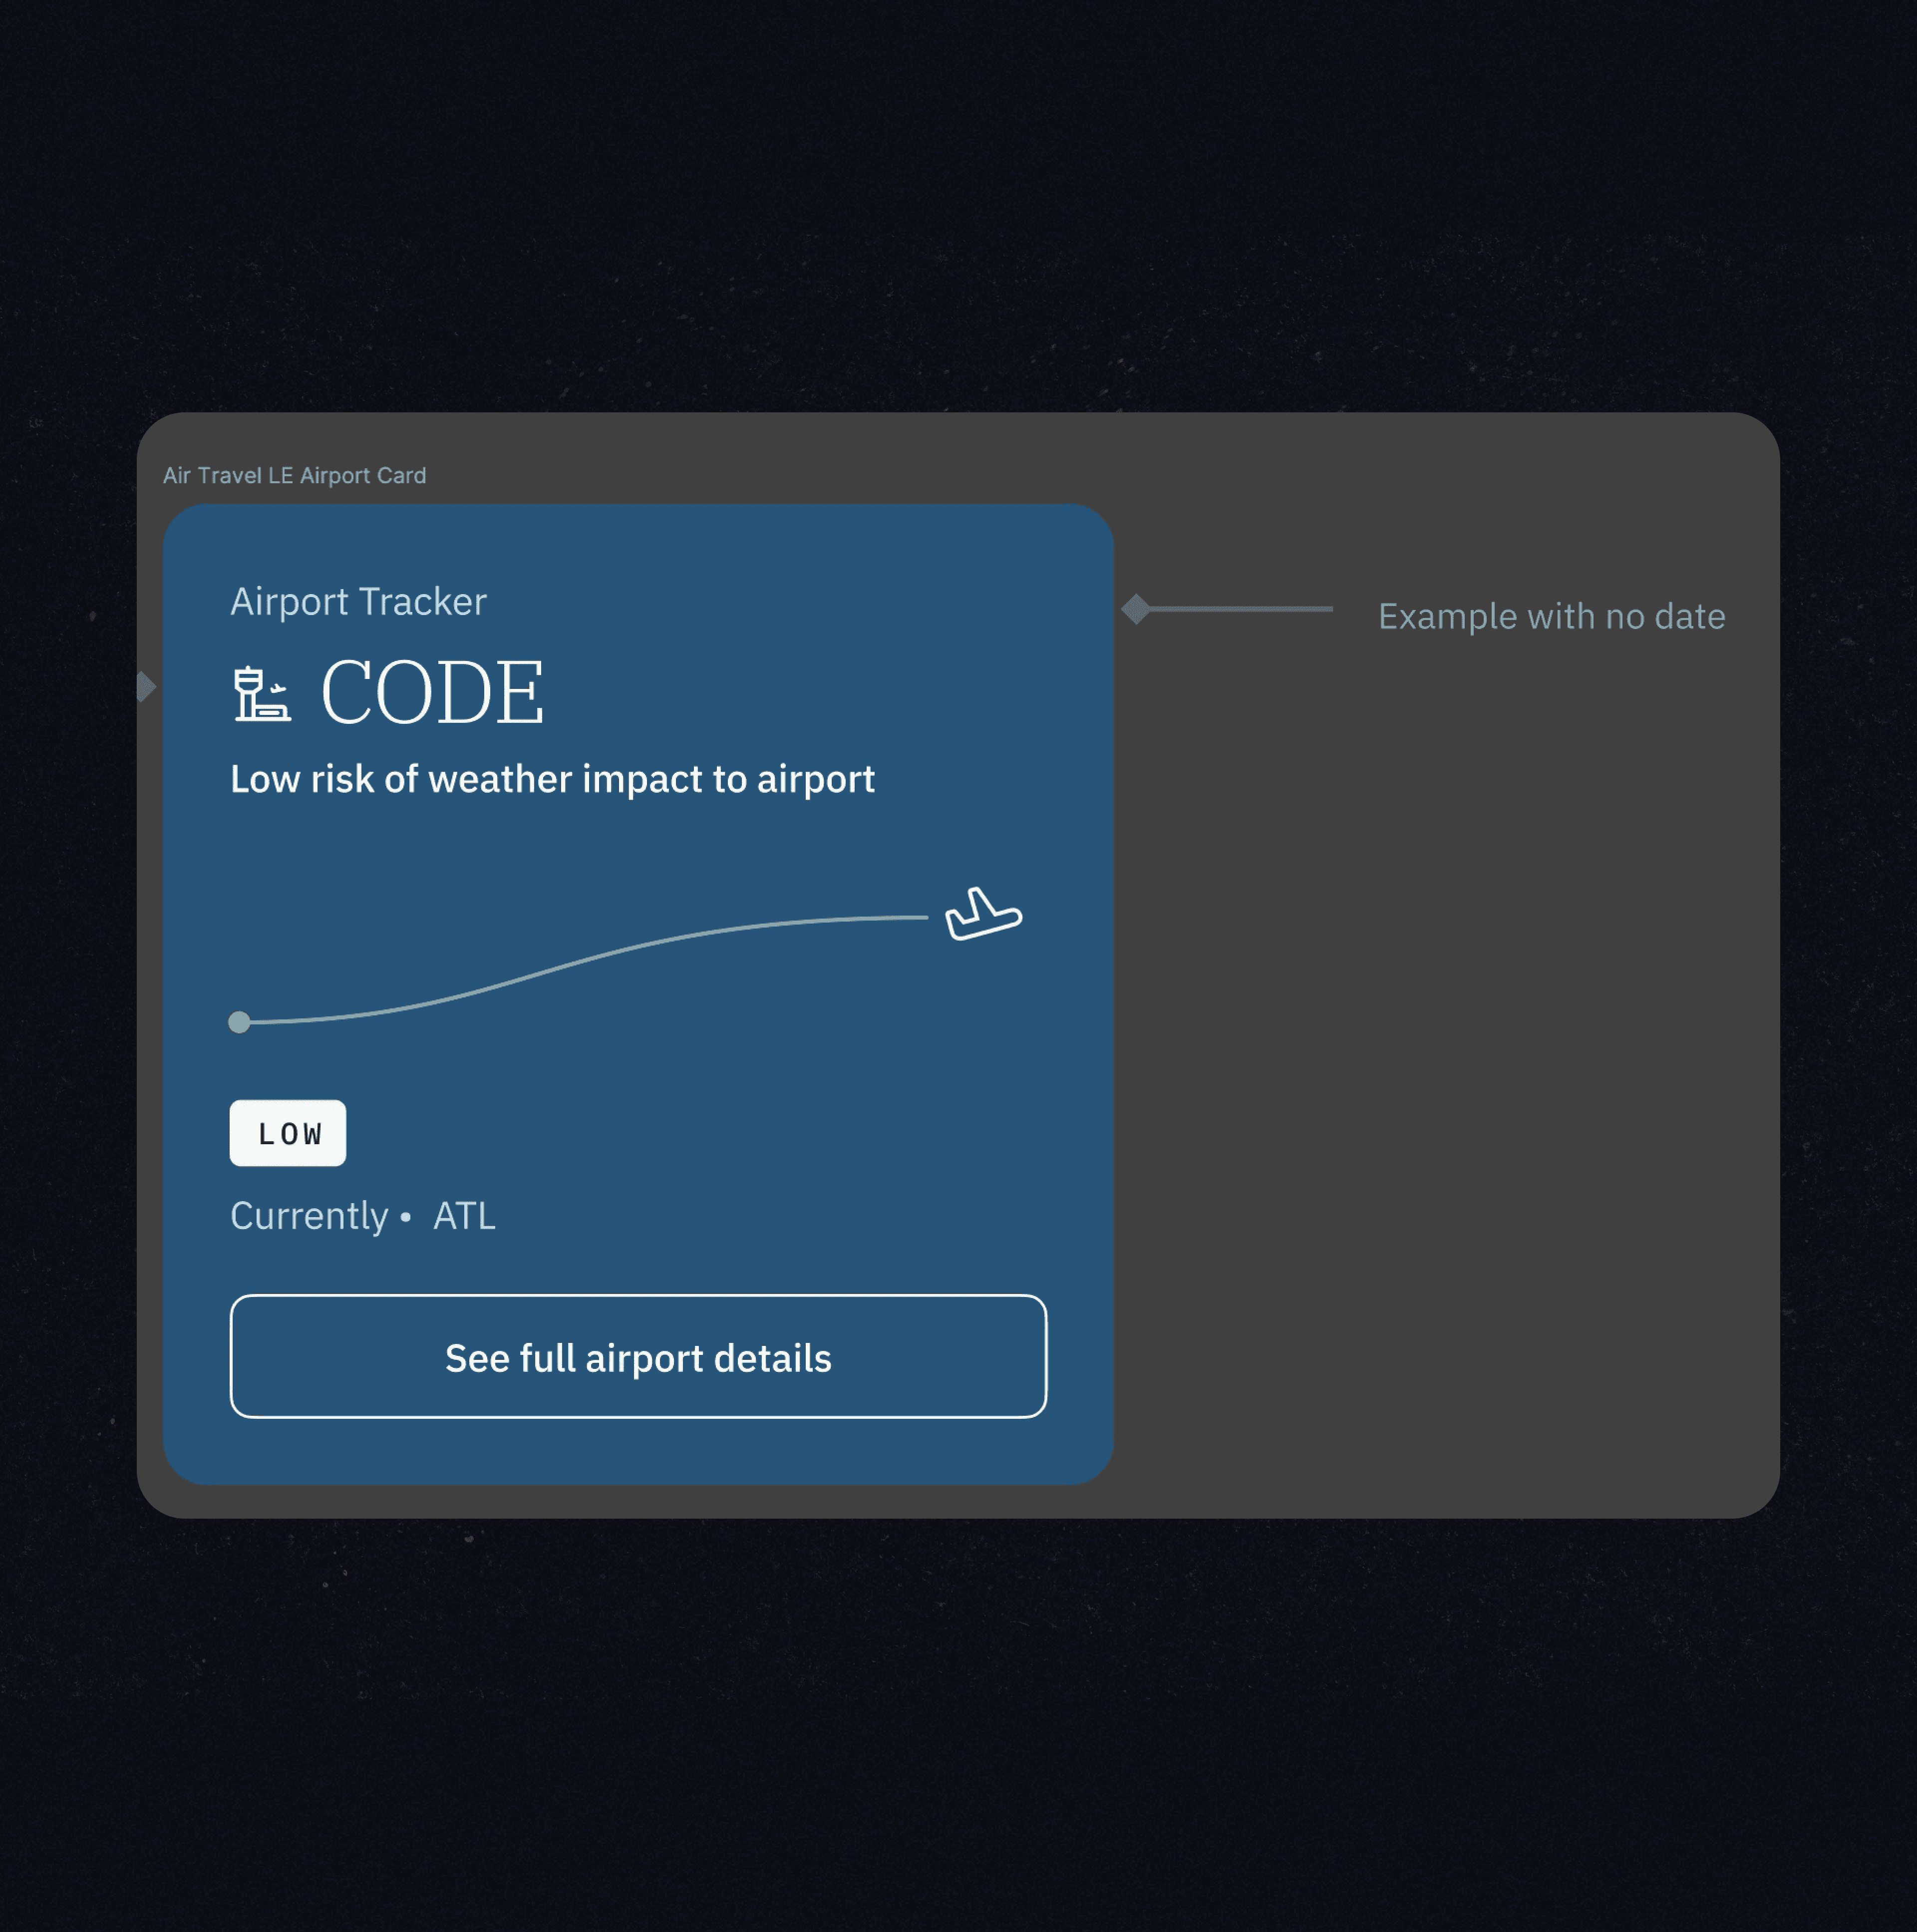
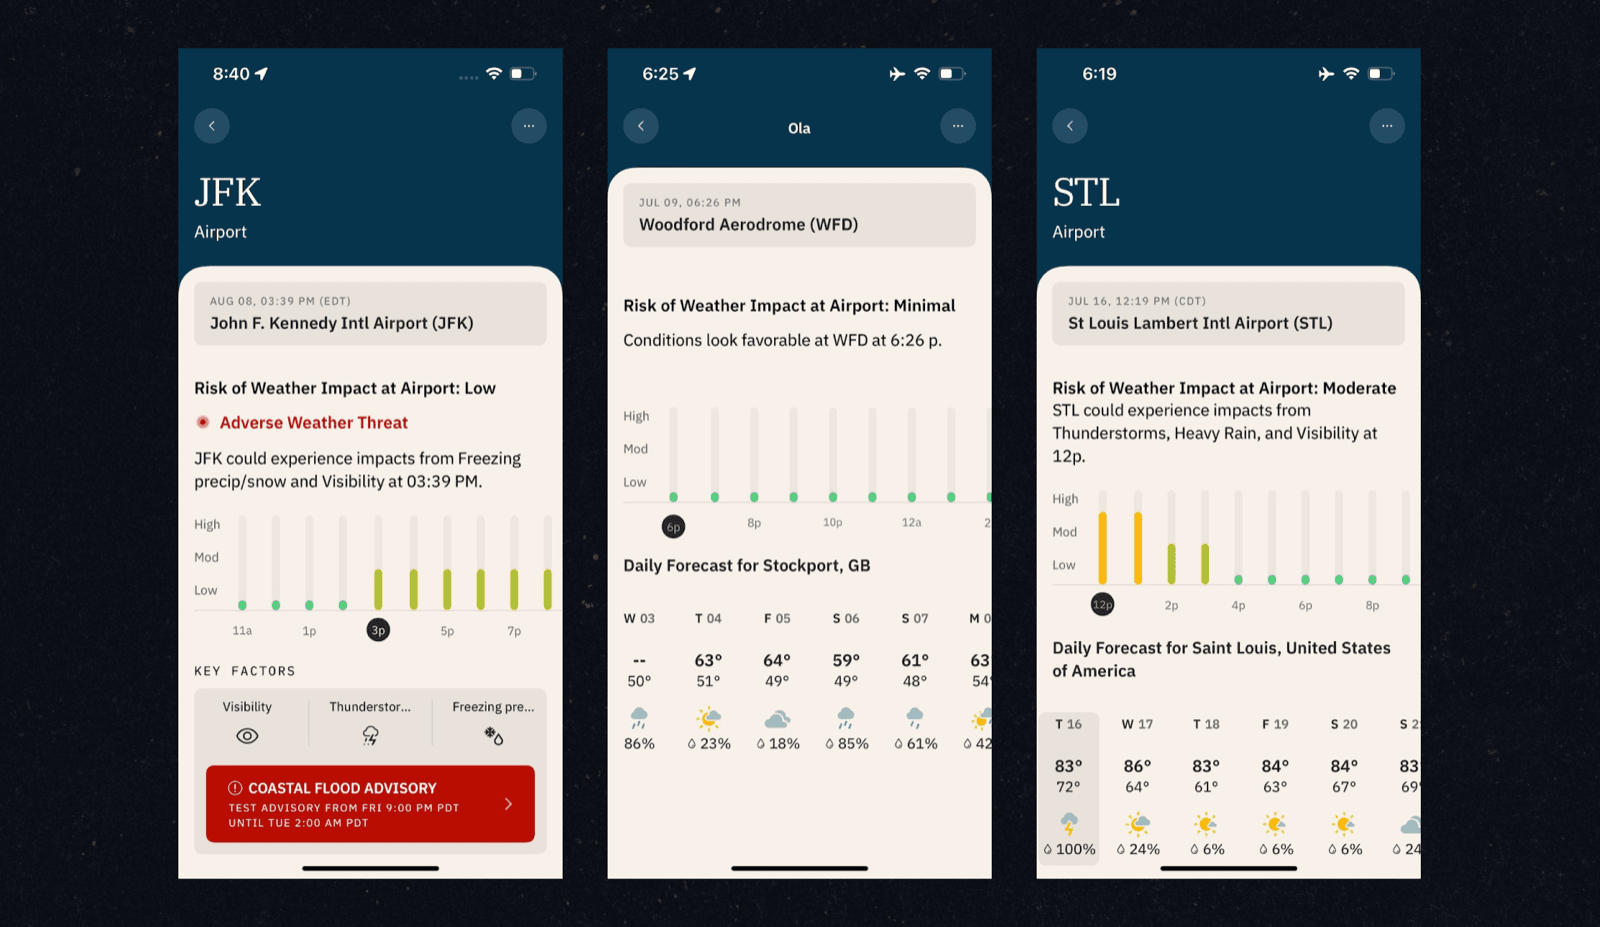
Travel Forecast was the stitching tool that didn’t exist. It turns a multi-city trip into one scannable timeline: departure, layover, arrival, and the risk windows called out where they matter.
The decision I held: risk language, not raw percentages
The design translated raw weather into travel impact. A 60% chance of rain became “tight connection risk due to storms.” That trades precision for meaning, which is exactly the kind of thing a build quietly reverts to a percentage when the translation logic gets hard. Holding the line on the risk language, and checking it read right against real forecast data, was one of the calls I owned at the gate.
The honesty ran the other way too. Flight numbers weren’t reliably available and layover timing shifted, so some of the richest timeline states got held back until the data could support them. Nothing shipped that promised more certainty than we actually had.
What changed
The Activity Hub shipped across web, iOS, and Android as part of The Weather Channel app, at 100M+ MAU. The Customer Journey flows unified across all three platforms. Sun and Moon shipped with every chart tied to a plain-language sentence. Travel Forecast introduced journey-level planning to a product that had only ever answered for a single location.
Underneath the features, the Andela engineering pipeline started shipping consistently against TWC design standards: fewer rounds of QA, fewer post-launch visual fixes, and a design library extended with patterns reusable across the broader product.
“I reframed the feature instead of redesigning it, then owned the last mile so the reframe survived the build.”
Reflection
The Weather Company taught me that working at consumer scale changes what design quality even means. At a startup, quality is about taste and craft. At 100 million users, it’s about discipline: the willingness to hold the line on a button radius across three platforms, every week, for a year, because the alternative is millions of people getting subtly different products.
Activity Hub, Sun and Moon, Travel Forecast: three different features, one lesson. Good design dies in the handoff if no one owns it. On these, I owned it.